


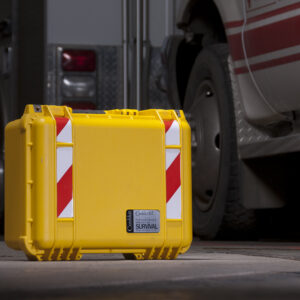
Professional Flight Series
CRASHKITS
-
Quick View
Crashkit 10Lite
$1,118.00 -
Quick View
Crashkit 6Lite
$786.00 -
Quick View
Crashkit 4Lite
$654.00 -
Quick View
Crashkit 2Lite
$396.00 -
Quick View
Crashkit 107
$1,745.00 -
Quick View
Crashkit 47
$996.00 -
Quick View
Crashkit 27
$542.00 -
Quick View
Crashkit 67
$1,242.00

Featured Products
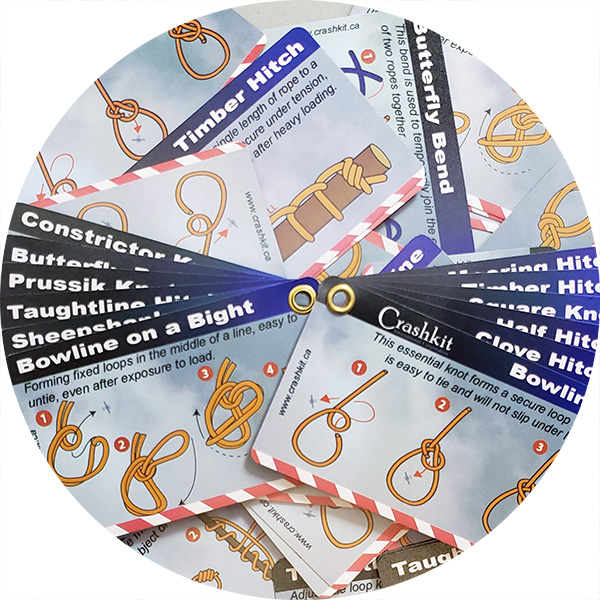
Custom Knot Card
Included in every Crashkit is our very own custom knot tying card. Featuring 12 different knots, these cards are about the size of a credit card, made from durable PVC, are waterproof and won't tear easily! Indispensable in an emergency and just plain handy to have around, we include an extra one with each Crashkit for you to keep in your wallet, too!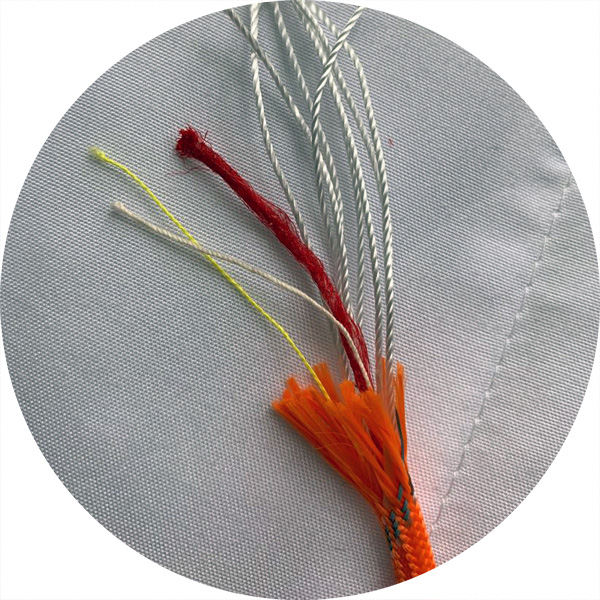
Crashkit FireCord
Produced exclusively for Crashkit, this Firecord features a 340kg break strength, triple-nylon inner core (7 strand), 1 fishing line, 1 cotton thread and 1 red hemp wax coated fire tinder. The custom sheath is International Orange with 3 reflective threads that can be seen from over a kilometer away.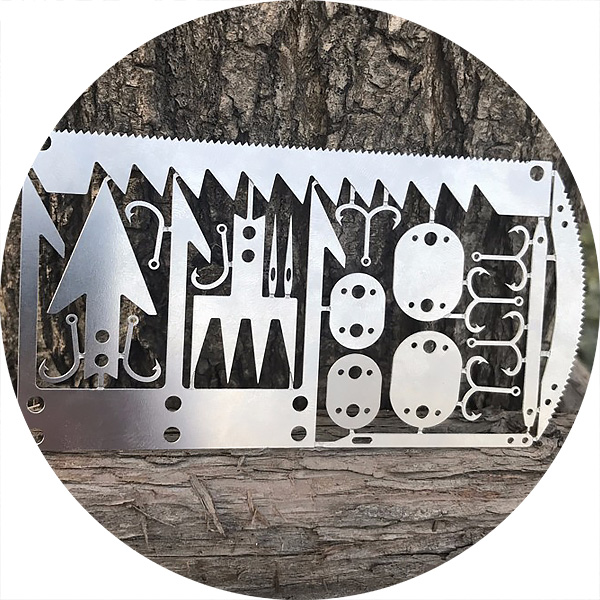
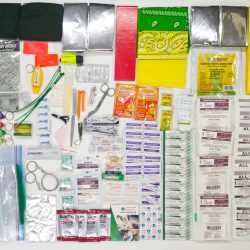
Fishing Kit
About the size of credit card, all Crashkits contain our lightweight tool card featuring 22 reusable implements. Survival saws, fine saw, sewing needles, trident spearhead arrowhead, small game arrowhead, single fish hooks, double fish hooks, snare hooks/lures, awl and tweezers.FAST SHIPPING
On a deadline? Audit? Emergency flight? Need it NOW? Give us a call, we can help.
RETURN BACK
Return or exchange within 30 days. Lifetime guarantee of excellence.
SECURE PAYMENT
All prices USD. BTC and DOGE payment also available.
Support 24/7
Here when you need us, give us a call!